PEPE Price Surge: Can the Bullish Flag Pattern Drive Prices to $0.000045?

The post PEPE Price Surge: Can the Bullish Flag Pattern Drive Prices to $0.000045? appeared first on Coinpedia Fintech News
With the crypto market nearing the $4 trillion market cap, the meme coins are on a rally. PEPE has increased nearly 7% among the top-performing meme coins over the past 24 hours.
Ranking as the 21st biggest cryptocurrency, PEPE is inching closer to a $10 billion market cap. Will the ongoing bullish rally result in an extended run for a new all-time high? Let’s find out.
PEPE Price Analysis
In the 4-hour chart, the price action showcases a sideways consolidation between $0.00001754 and $0.00002332. The consolidation range also forms two parallel trend lines.
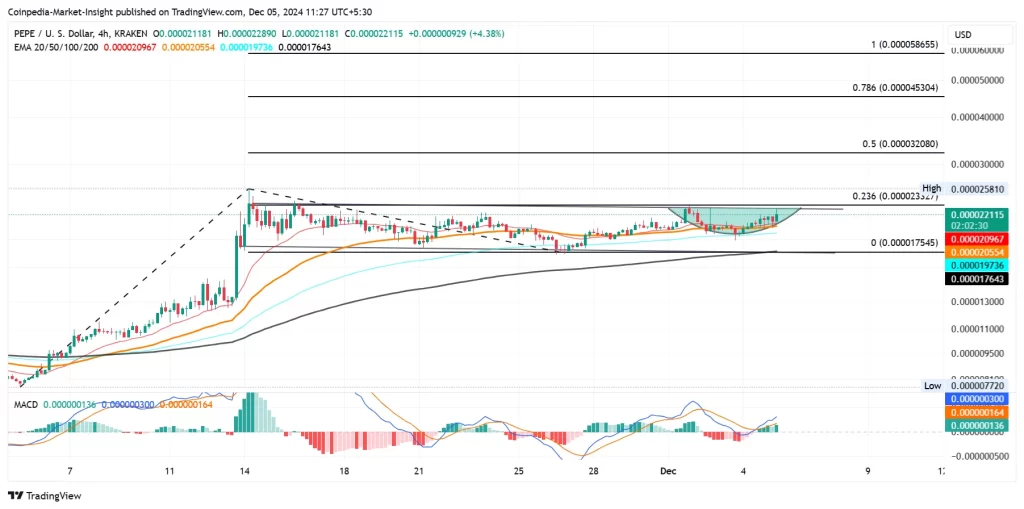
Furthermore, the mentioned boundary lines coincide with the 0.00002360% Fibonacci level. The sideways range forms a bullish flag pattern with the prevailing bull run.
The PEPE price is currently trading at $0.00002205 with a higher price action in the 4-hour candle. This bullish candle is challenging the overhead ceiling by completing a rounding-bottom reversal.
PEPE Technicals and Price Targets
As the broader market recovers, the short-term recovery in PEPE results in a bullish crossover in the MACD and signal lines. Furthermore, the dynamic support from the 50-EMA line and the 100-EMA line in the 4-hour chart increases the chances of a breakout rally.
The neckline of the rounding-bottom pattern coincides with the 0.00002360% Fibonacci level. In case of a bullish surge beyond the 23.60% Fibonacci level at $0.00002332, the massive surge will surpass the current all-time high level at $0.00002581.
Using the trend-based Fibonacci levels, the upside price targets are at $0.00003208, followed by $0.00004530. In case of a bullish failure, a sideways continuation will likely continue via solid support at $0.00001754 in confluence with the 200-EMA line.
Read More: Pepe Price Prediction 2025-2030
FAQs
If the price breaks the $0.00002332 resistance level, the meme coin could surpass its all-time high of $0.00002581, targeting $0.00003208.
The key support level for PEPE is at $0.00001754, coinciding with the 200-EMA line, which could prevent a further downside.
The immediate upside targets for the meme coin are $0.00003208 and $0.00004530, based on trend-based Fibonacci levels.