PEPE Poised For 40% Rally, Here’s Why
The post PEPE Poised For 40% Rally, Here’s Why appeared first on Coinpedia Fintech News
Pepe (PEPE), the popular and third-largest crypto meme coin, has successfully formed a bullish price action pattern, garnering significant attention from crypto enthusiasts. Today, March 18, 2025, as sentiment across the crypto landscape begins to shift and assets gain upside momentum, PEPE has reached the breakout level of its bullish price action pattern.
Pepe (PEPE) Technical Analysis and Upcoming Levels
According to CoinPedia’s technical analysis, PEPE has formed a bullish inverted head and shoulders pattern on the four-hour timeframe and is currently on the verge of a breakout. After the market witnessed upside momentum, the meme coin soared significantly and reached the breakout area.
Based on the recent price momentum, if PEPE breaks out of the pattern and closes a four-hour candle above the $0.0000075 level, there is a strong possibility it could soar by 40% to reach the next resistance level of $0.00001050 in the coming days.
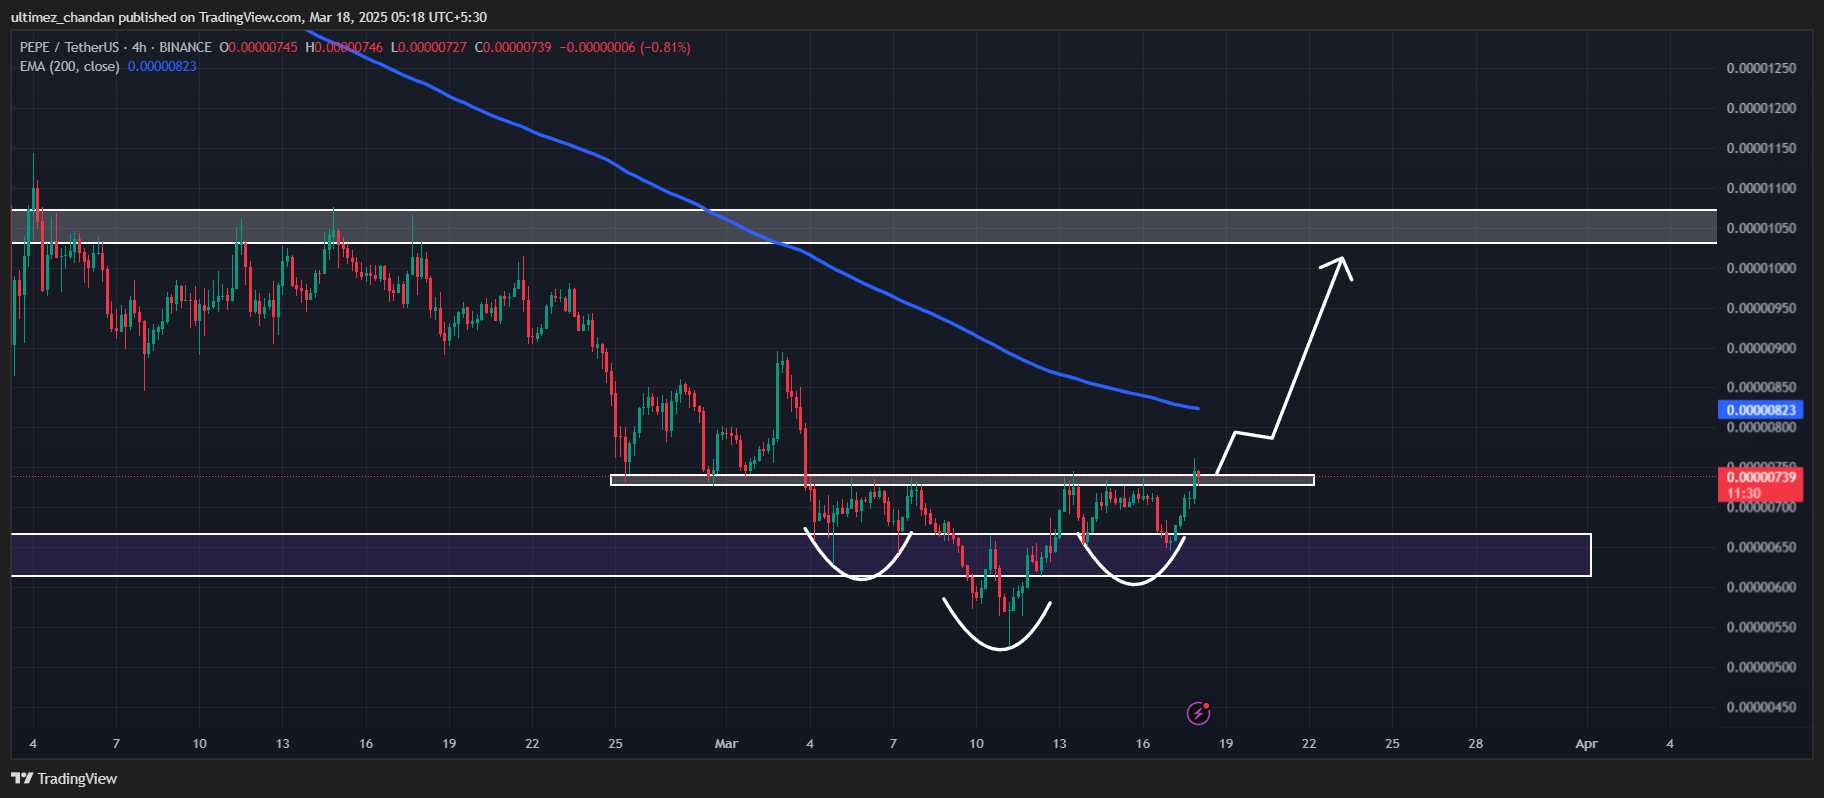
In trading and investing, a successful breakout of an inverted head and shoulders pattern is always considered a bullish sign and often shifts overall market sentiment.
Expert Bullish Outlook
Looking at the bullish outlook, a crypto expert shared a post on X (formerly Twitter), featuring an eight-hour PEPE chart that appears to be breaching a falling wedge pattern. The expert also noted that if the meme coin successfully breaks out, PEPE could soar by 50% to 60% in the coming days.
Current Price Momentum and Over-Leveraged Levels
PEPE is currently trading near $0.00000733, registering a price surge of over 13% in the past 24 hours. Meanwhile, its trading volume has soared by 45%, indicating heightened participation from traders and investors. Additionally, the chart has formed a bullish pattern and is poised for upside momentum.
With the bullish outlook, traders have been strongly betting on the long side, as reported by the on-chain analytics firm Coinglass.
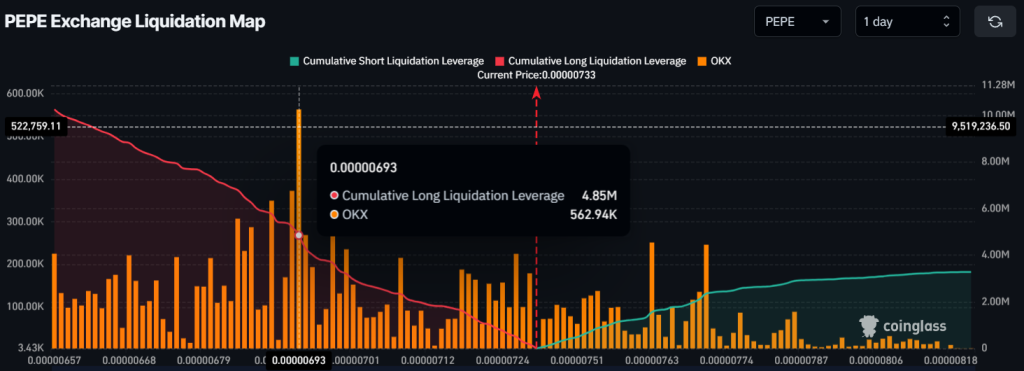
Data reveals that traders are currently over-leveraged at $0.00000693 on the lower side and $0.00000771 on the upper side, holding $4.85 million and $2.35 million worth of long and short positions, respectively. This on-chain data particularly confirms that bulls are currently dominating.