Ethereum Price Analysis: What’s Next for ETH After 50% Monthly Surge?
Ethereum continues to consolidate just below a key resistance zone following an impressive rally from earlier this month. While price remains technically bullish, ETH has yet to confirm a breakout above this critical level.
Technical Analysis
The Daily Chart
On the daily chart, ETH is trading just below the confluence of the 200-day and the $2,800 supply level. Yet, the 100-day moving average is currently below the asset, providing support just below the $2,100 demand zone. With the price being trapped between these two moving averages, a breakout to either side could be the beginning of a new impulsive move.
Meanwhile, the RSI sits around 66, just below overbought conditions but on a downtrend, reflecting slowing upside strength, with a bearish divergence forming, which indicates that a correction is probable in the coming weeks.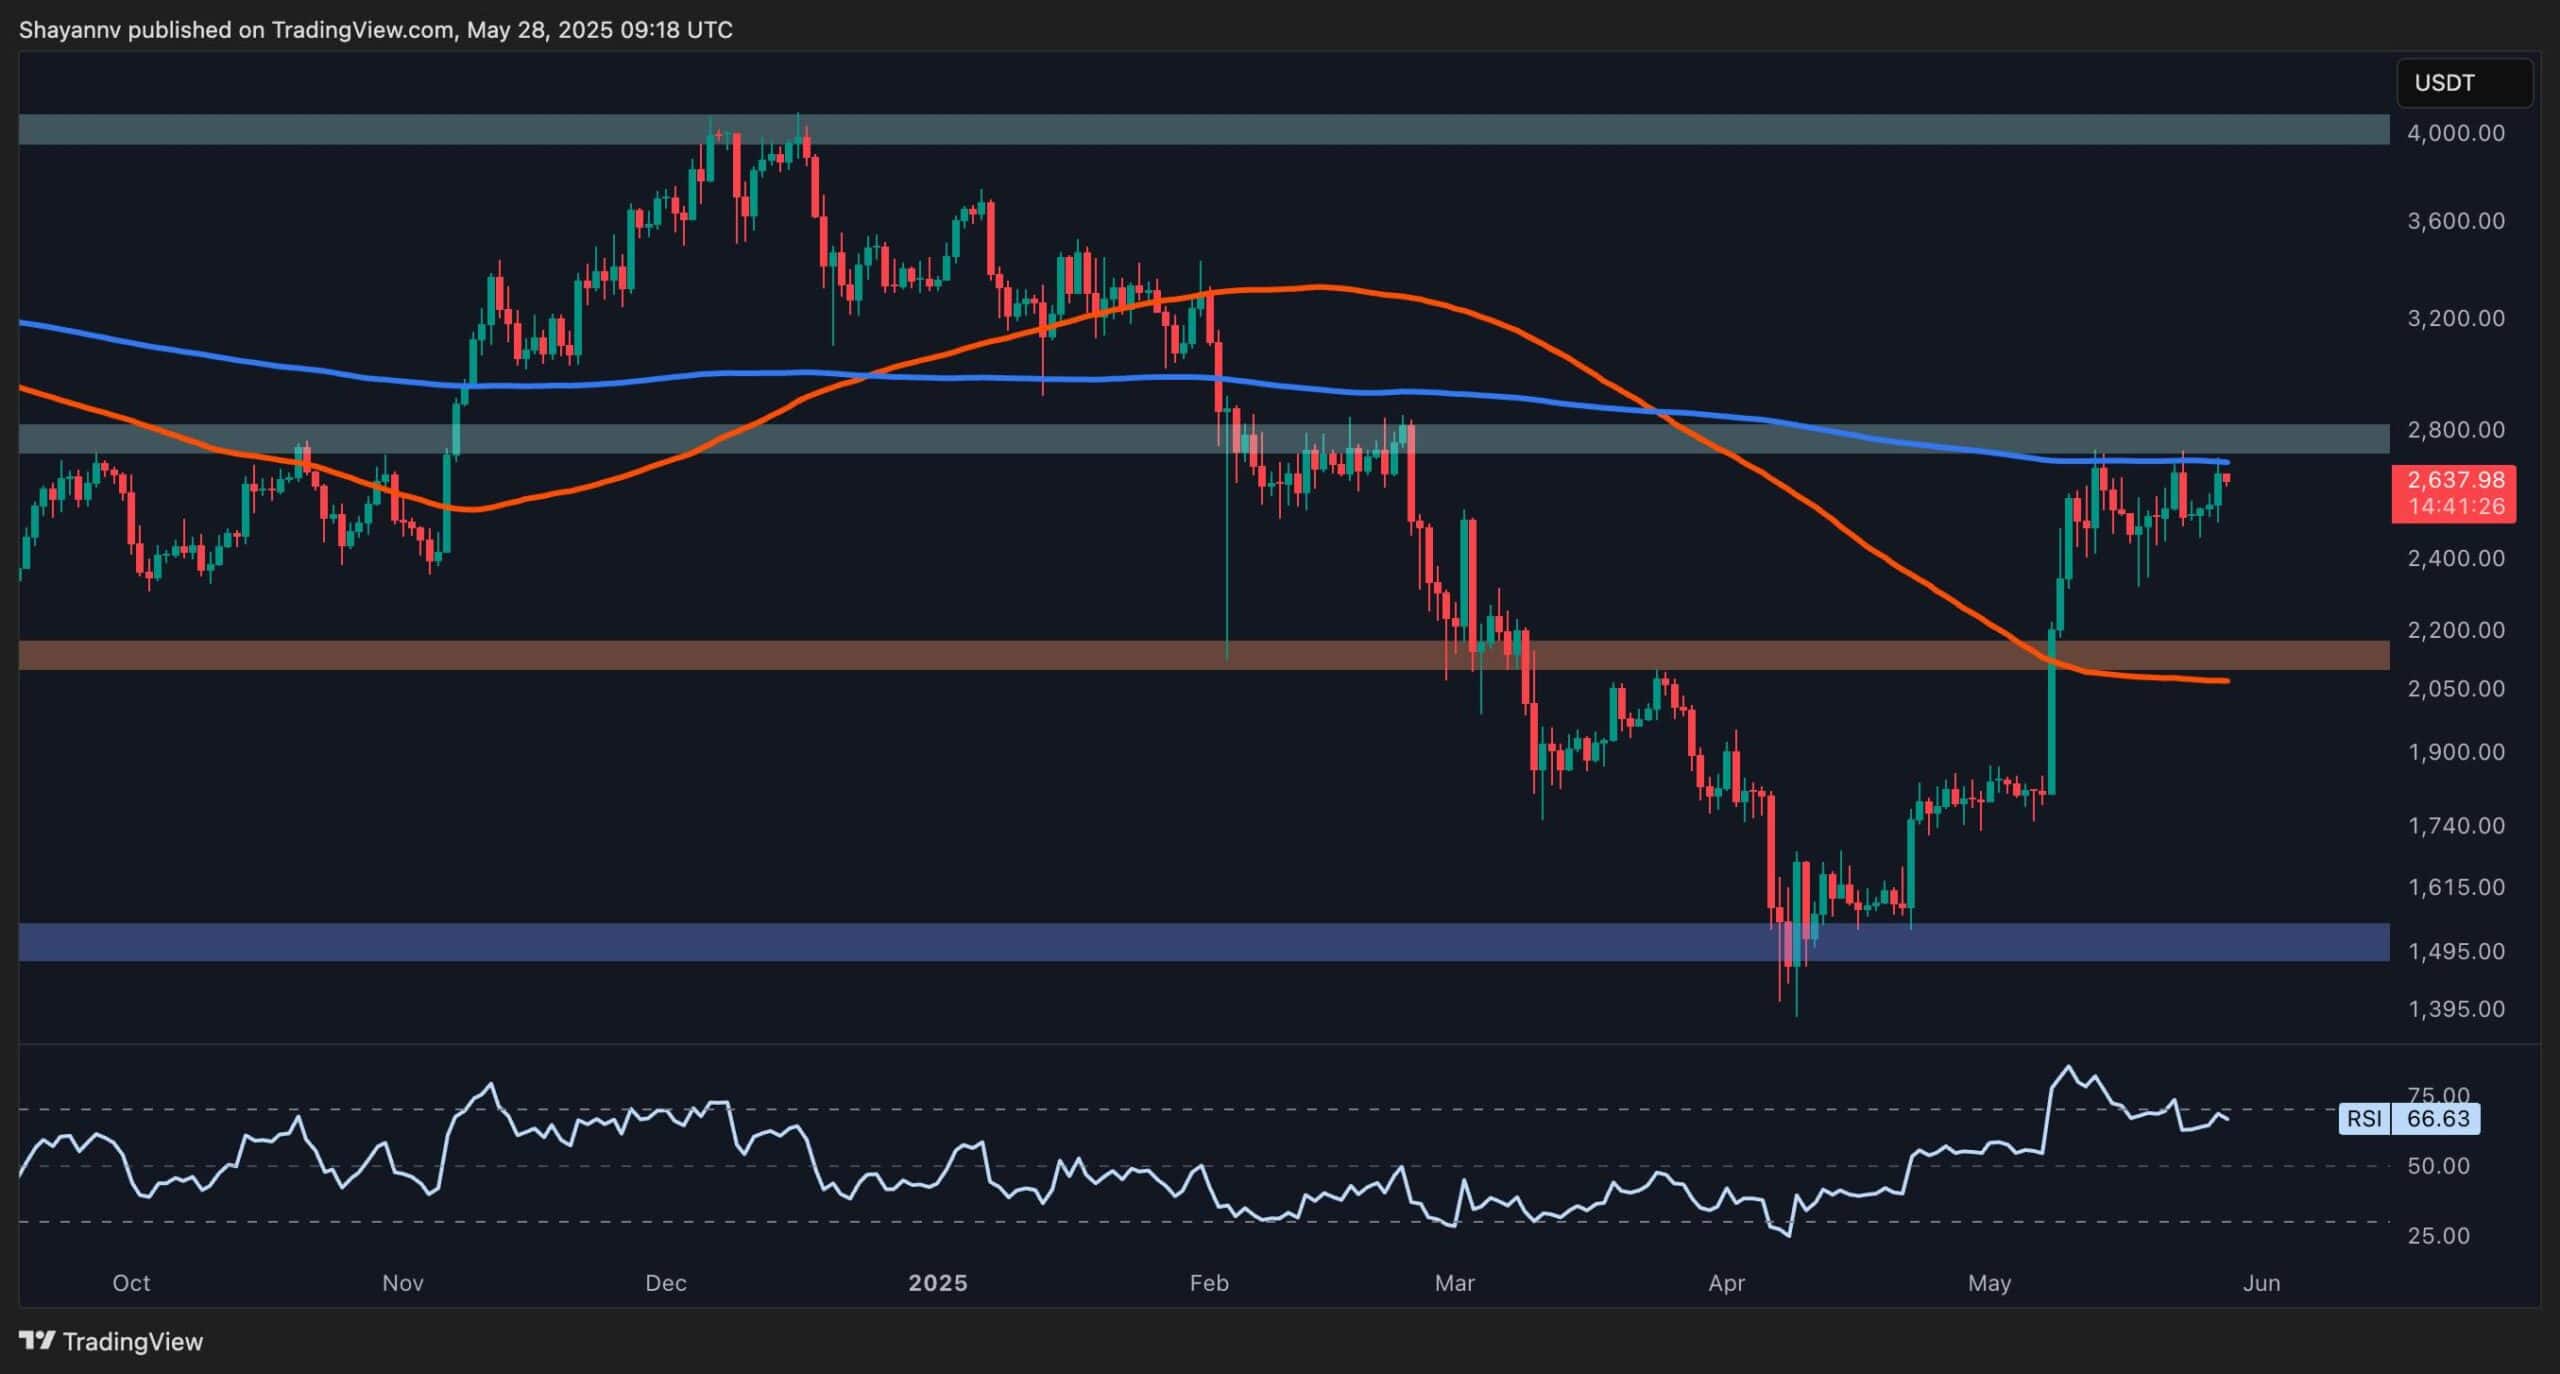
The 4-Hour Chart
Dropping lower on the 4-hour timeframe, Ethereum is showing signs of weakening momentum. After the explosive move above $2,100, the price has been consolidating within a narrow ascending channel near the $2,500–$2,600 range. Yet, the RSI has been on a slight uptrend, indicating that the momentum is slowly shifting in favor of the buyers on this timeframe.
Yet, for any meaningful rally to begin, the market needs to break out of the channel with force and volume. Otherwise, a drop below the $2,600 level, which is now acting as a short-term support, would likely lead to a breakdown of the channel and a price decline back toward the $2,100 demand zone.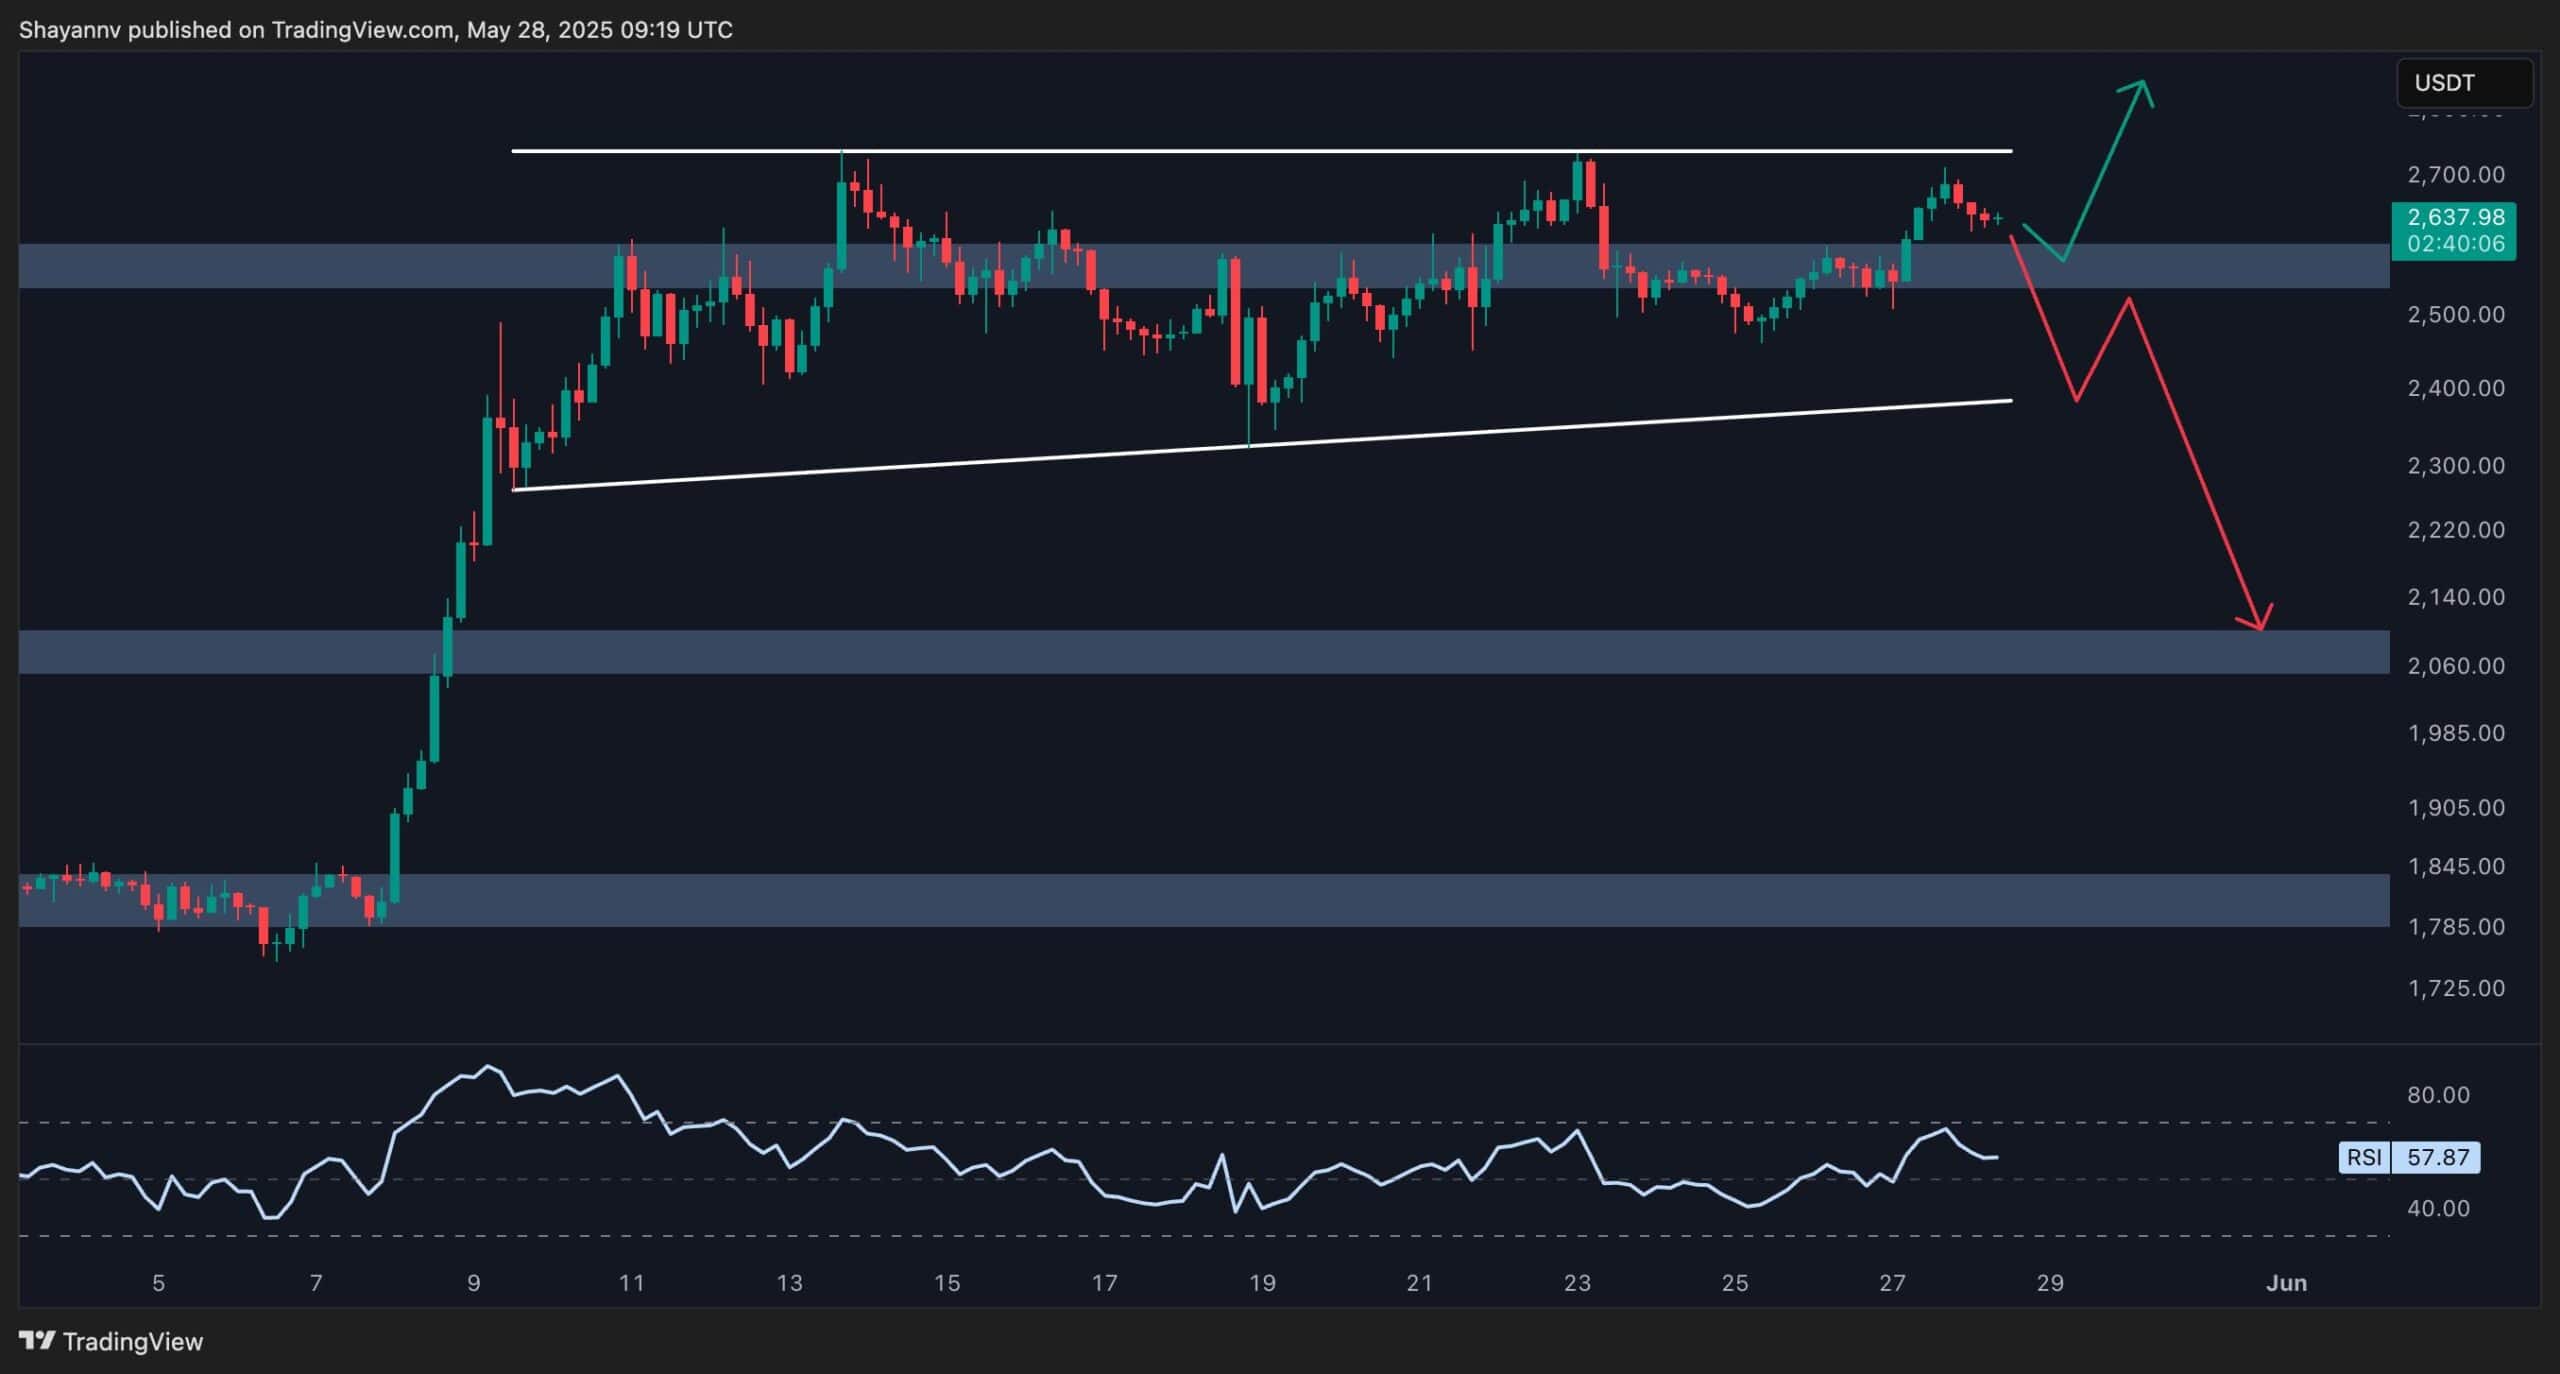
Sentiment Analysis
Ethereum’s open interest has surged sharply, now standing at $18.5B, approaching its previous all-time highs seen at the beginning of the year. This significant uptick in open interest alongside rising prices suggests a buildup of leveraged long positions across the market.
While this often indicates strong bullish sentiment and trader confidence, it also introduces potential risk. When open interest climbs aggressively without a clear breakout, it can signal overcrowding and increase the chances of a liquidation-driven pullback. The current positioning reflects high anticipation of a breakout above $2.8K.
However, if ETH fails to clear that resistance, the market could see a swift correction as overleveraged longs are flushed out. 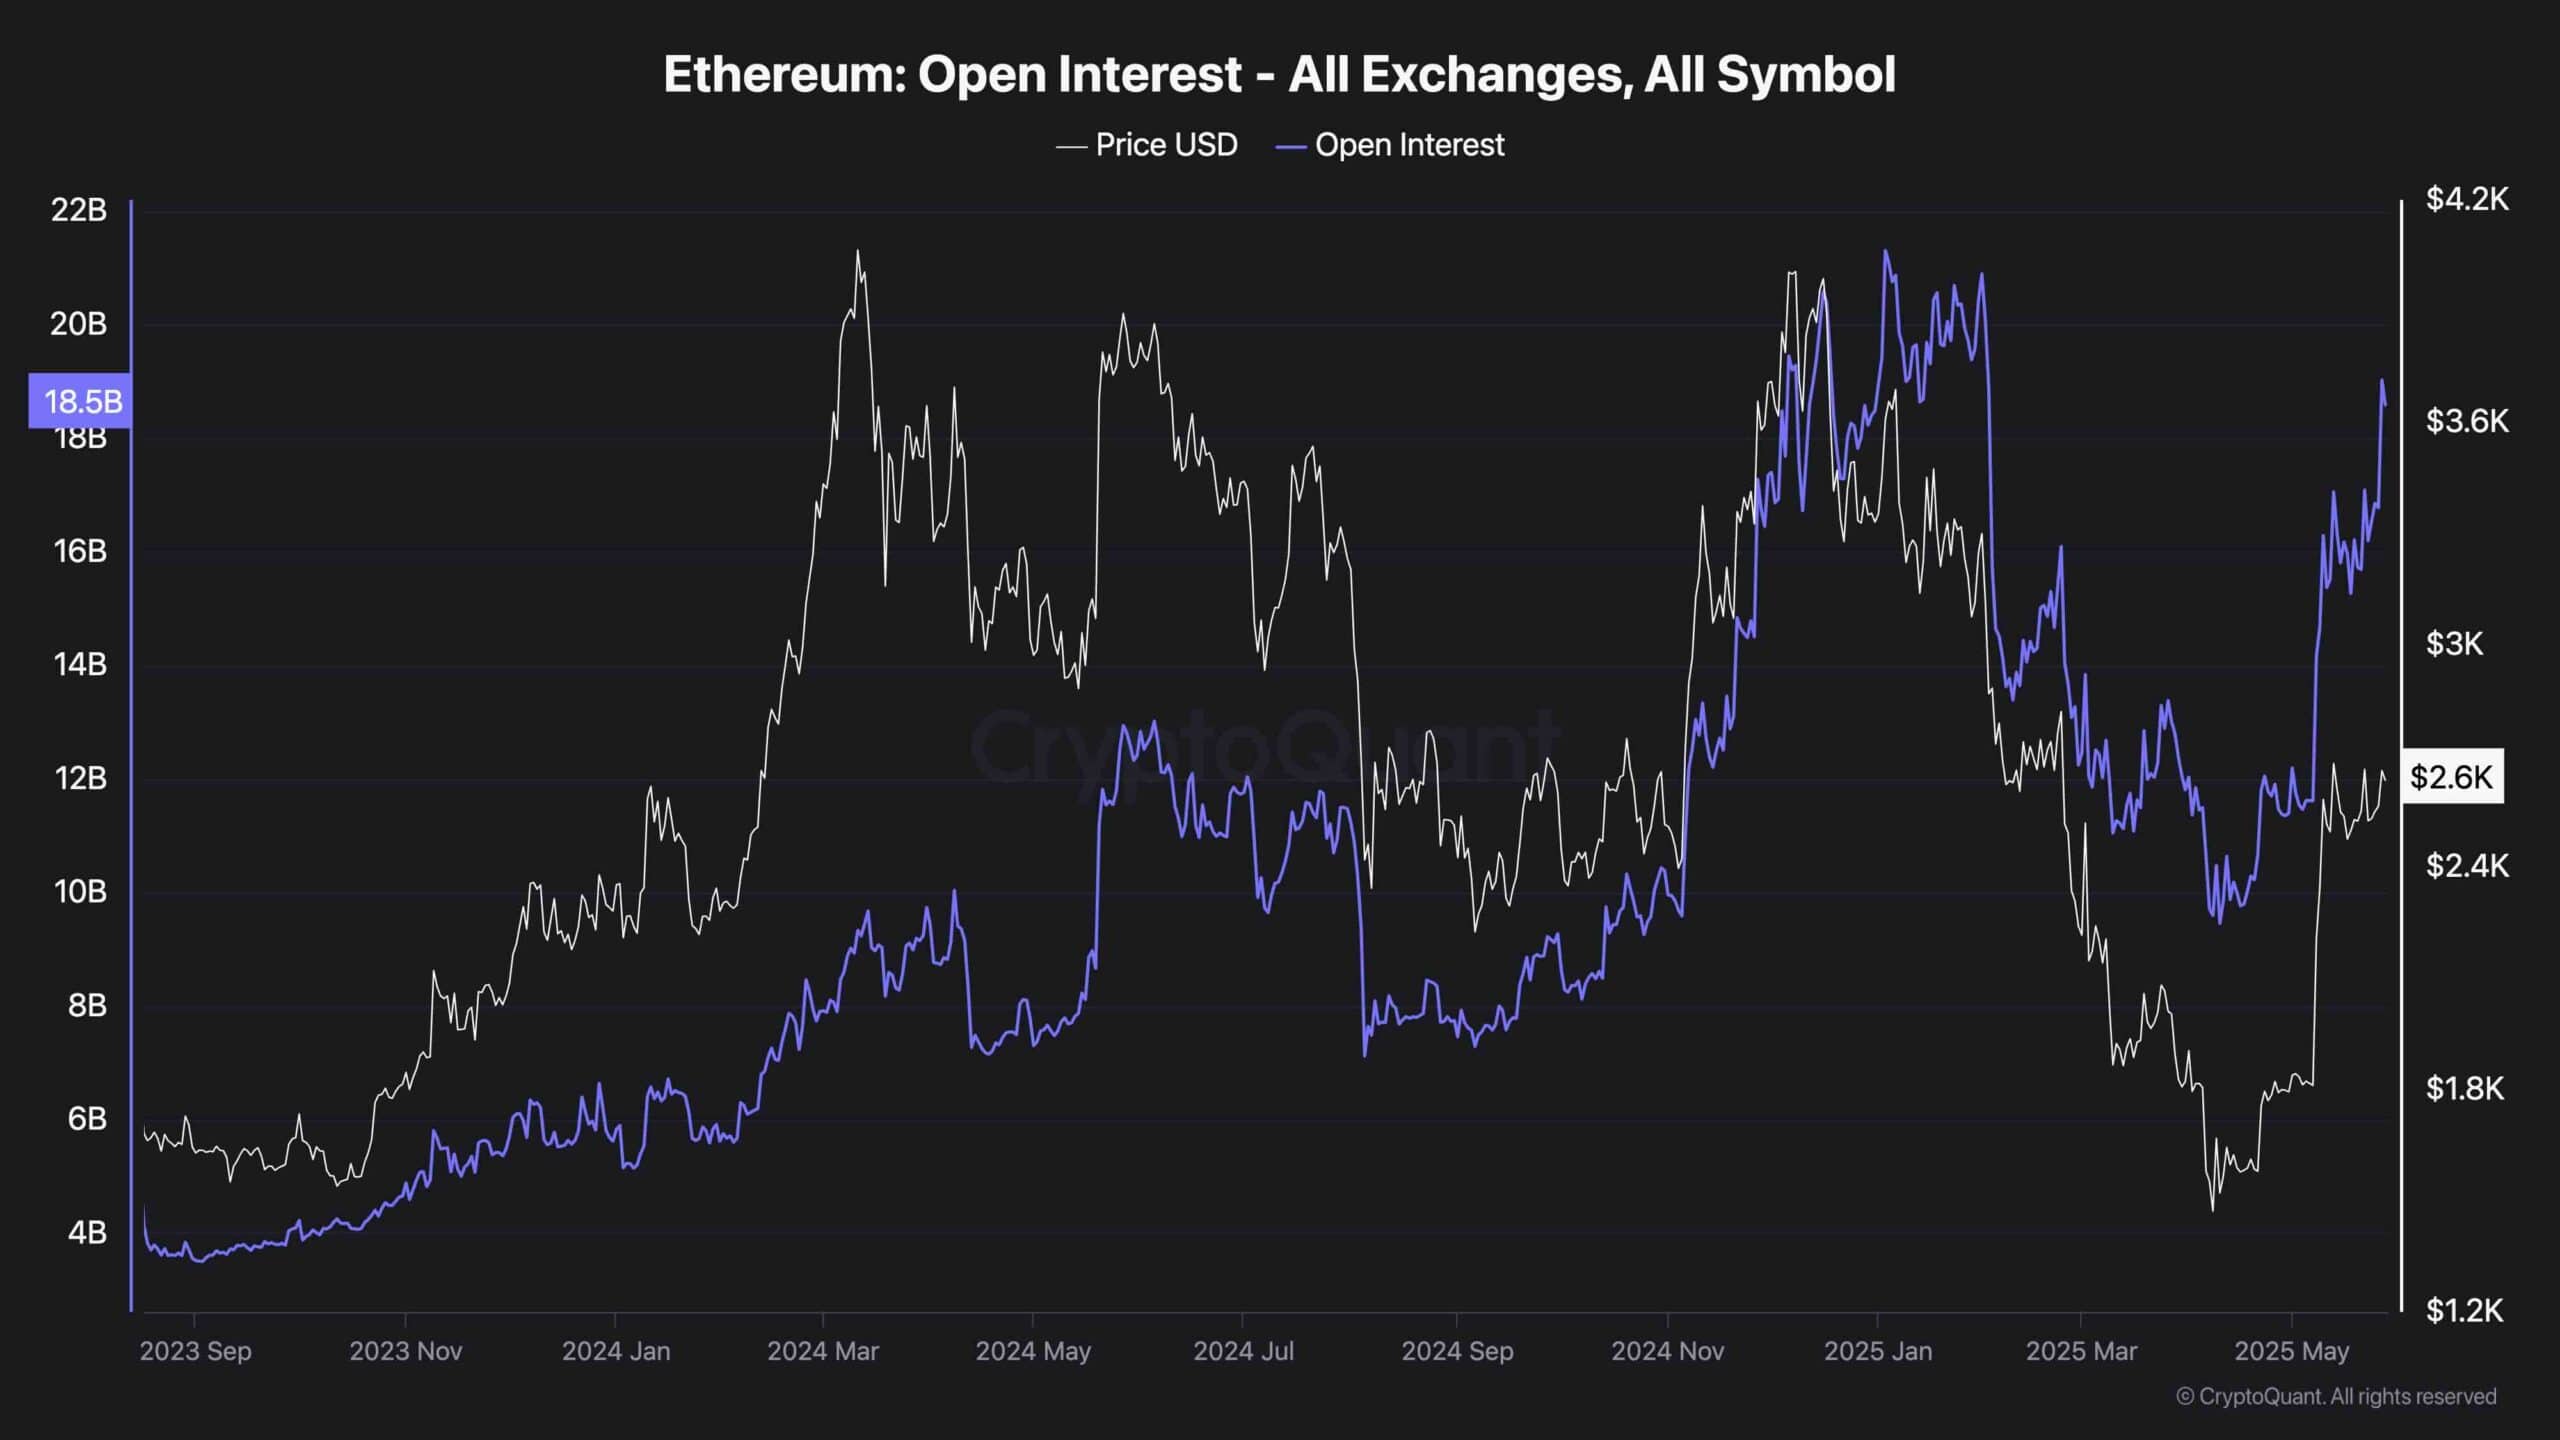
The post Ethereum Price Analysis: What’s Next for ETH After 50% Monthly Surge? appeared first on CryptoPotato.