Bitcoin Set for Further Decline As Bearish Sentiment Intensifies
Bitcoin (BTC), the leading cryptocurrency by market capitalization, appears to be heading for further declines as market sentiment turns increasingly bearish. Recent analysis shows that BTC is struggling to maintain key support levels, and the overall mood among traders and investors is shifting towards caution. Several factors such as macroeconomic pressures, regulatory concerns, and technical indicators contribute to this negative outlook.
As Bitcoin continues to face selling pressure, the potential for additional downside becomes more pronounced. This article explores Bitcoin’s near-term price action for market participants looking to navigate the current volatility and make informed decisions about their BTC holdings.
Currently, the price of BTC is down by -2,50%, trading at about $67,796, with a market capitalization of over $1.3 trillion and a trading volume of over $29 billion as of the time of writing. Although its market capitalization is down by 2.44%, its trading volume is up by 94,43% in the past day.
Technical Analysis Points Further Decline In Bitcoin Price
BTC on the 4-hour timeframe has dropped below the 100-day Simple Moving Average (SMA) with strong momentum by dropping two bearish candlesticks. With such momentum, the price of BTC may decline more.
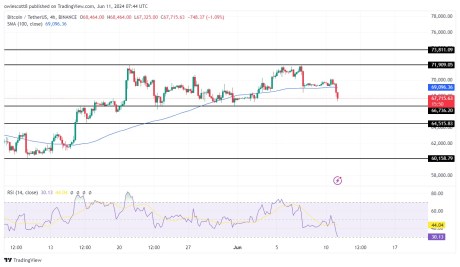
The 4-hour RSI has also experienced a huge drop below 50% trending close to the oversold zone. This confirms that BTC may still witness more price declines.
On the daily timeframe, BTC’s price with a strong momentum is making a significant drop toward the 100-day SMA with a huge bearish candlestick. Based on the above price action, it can be suggested that BTC may remain bearish for the rest of the day.

Finally, the 1-day Relative Strength Index (RSI) also suggests that the price of Bitcoin is likely to decline more, as the RSI line has dropped slightly below 50% and might trend there for a while.
More Losses For BTC?
Based on price analysis and what the RSI indicator suggests, if Bitcoin continues to decline, it will move toward the $66,736 support level. If it breaks this level, it will decline further to test the $64,515 support level. There is a possibility that it might even drop more to test the $60,158 if the aforementioned level cannot hold the price.
However, suppose BTC decides to reverse course at any of the previously suggested support levels, it will start to ascend toward the direction of the $71,909 resistance level. If the price breaks above this resistance level, it may move to test the $73,811 level and possibly move further to create a new all-time high.