Bitcoin Could See Next Top At $89,200, Crypto Analyst Suggests
According to this on-chain indicator, an analyst explained how the next potential local top for Bitcoin could be $89,200.
Bitcoin CVDD “Assessing Tops” Metric Could Suggest Next Potential Top
In a new post on X, analyst Ali Martinez has talked about where the next top for BTC could be based on the Cumulative Value Days Destroyed (CVDD). The CVDD is an on-chain metric derived from the “Coin Days Destroyed” (CDD).
A “coin day” is the quantity that 1 BTC accumulates after sitting dormant on the blockchain for 1 day. When a coin that has accumulated a certain number of coin days is moved on the network, the coin days it was carrying naturally reset back to zero and are said to be “destroyed.”
The CDD measures the number of coin days being destroyed across the market on any given day. Since every transaction also carries some USD value based on the price at its time, the CVDD adds another layer of context to the CDD by accounting for the USD value of every coin, breaking dormancy to destroy its coin days.
Unlike the CDD, which tracks only the number of coin days being destroyed on any given day, the CVDD is a cumulative sum of the asset’s history. More formally, the CVDD is calculated as a ratio between the cumulative sum of the value-time destruction on the network divided by the age of the cryptocurrency.
Analyst Willy Woo devised the original CVDD, which has proven remarkably accurate for locating historical bottoms in the asset’s price. In the context of the current topic, though, the “Assessing Tops” modification from CryptoQuant author Binh Dang is of interest.
This indicator combines the 50-day moving average (MA) of the Bitcoin spot price with the CVDD and aims to assess probable points of tops in the asset, as its name suggests.
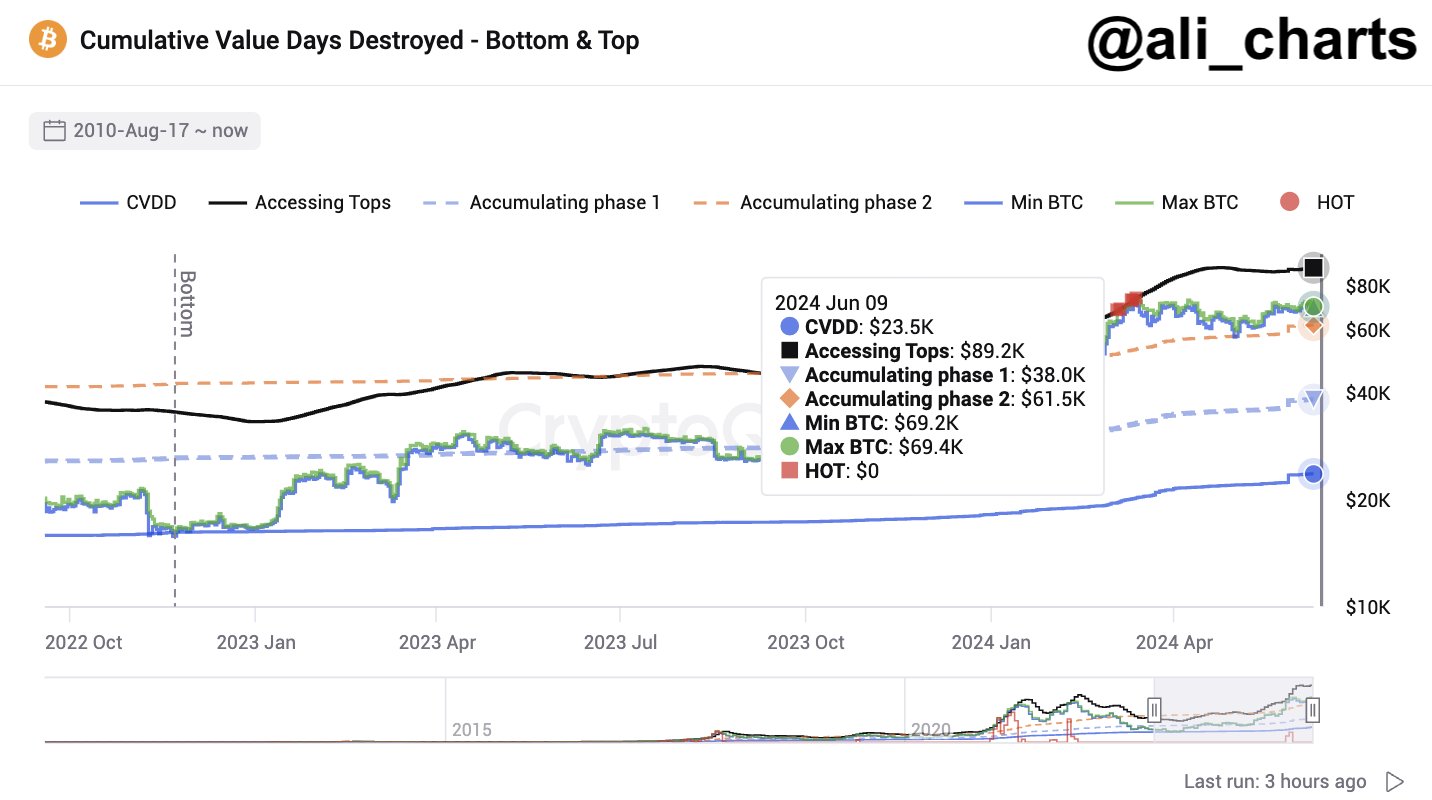
Now, here is a chart that shows how the value of the Bitcoin Assessing Tops has looked like recently:
From the chart, it’s visible that the Bitcoin spot price had briefly breached the Assessing Tops back in March. When the asset exceeds this indicator, its price is generally overheated and prone to forming tops. It would appear that this had also held up during this recent break, as the asset had shortly reached a top following it.
The Bitcoin Assessing Tops indicator currently has a value of $89,200. While a top may not necessarily form if Bitcoin rises to this level, a peak may indeed at least become close when it does so if this indicator is to go by.
BTC Price
At the time of writing, Bitcoin is trading at around $69,300, down more than 1% over the past week.


