Bitcoin (BTC) Stability and Long-Term Holding: Market Dynamics Analysis
The Bitcoin (BTC) price has consistently traded within the $67,000 and $68,000 range for several days. In this analysis, BeInCrypto aims to understand the price action of Bitcoin.
Additionally, we have observed a decline in volatility, which can be attributed to various factors. To provide a comprehensive analysis, we’ll explore who is buying and selling Bitcoin.
Examining Bitcoin Activity and Vaulting Rates
The chart below illustrates the activity rate and vaulting rate of Bitcoin over time, along with its price in USD. Here are the key observations from the chart:
Activity Rate (shown in red):
The Activity Rate shows how much Bitcoin is actively traded or moved by users, indicating how often people use or transfer their BTC.
Notable spikes and drops indicate periods of increased and decreased activity among Bitcoin holders. Significant fluctuations can be observed, particularly around key price movements. We have observed a fascinating drop in the activity rate, from 9% to -3%. This decrease in activity could indicate a trend towards long-term holding of Bitcoin.
Vaulting Rate (shown in green):
The Vaulting Rate shows how much Bitcoin users are moving into long-term storage, keeping it safe for the future (Vaulted Supply represents the percentage of Bitcoin that has been vaulted or has never been sold since its first acquisition).
Positive vaulting rates suggest that investors are moving more BTC into long-term storage. The chart shows periods where the vaulting rate increases, potentially indicating holders’ confidence in the asset’s future value.
Read more: Who Owns the Most Bitcoin in 2024?
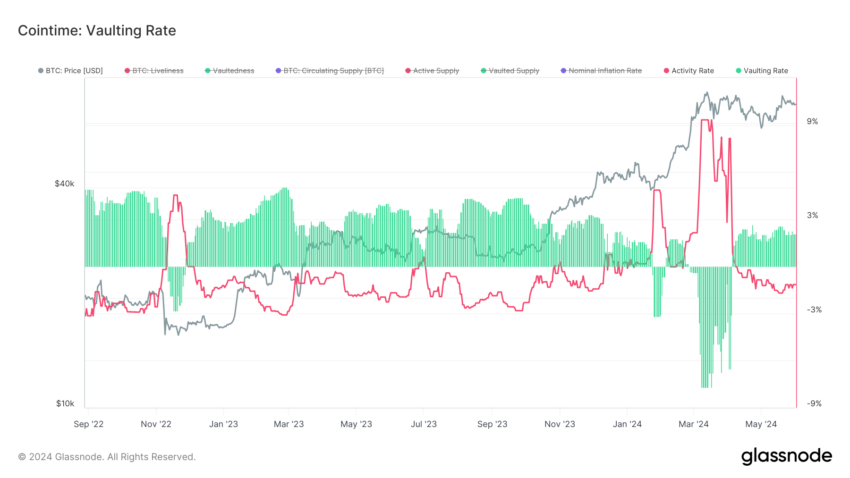
The decline in activity and the rise in vaultedness could explain the decreasing volatility trend.
Understanding the UTXO Value Distribution Monitor
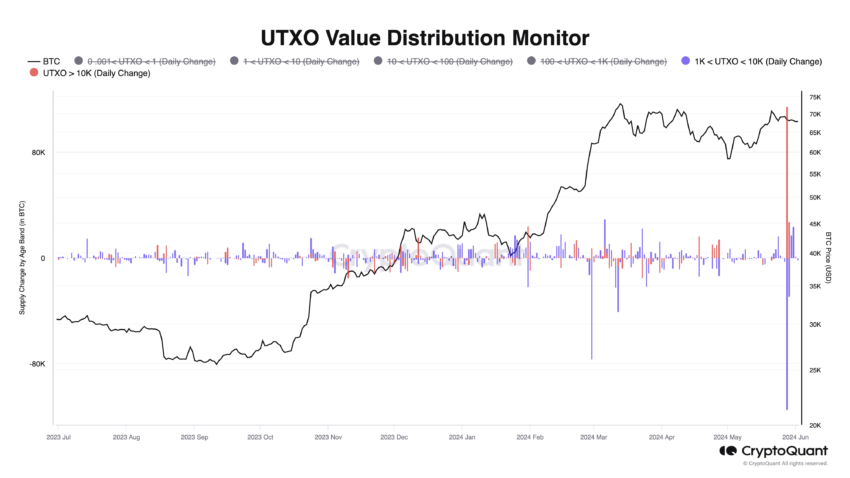
The UTXO (Unspent Transaction Output) Value Distribution Monitor analyzes BTC transactions based on the value of BTC held in different wallets. Let’s break it down in simple terms and explain what this indicator tells us.
What is UTXO?
UTXO stands for Unspent Transaction Output. It refers to the amount of Bitcoin received after a transaction that can be used in future transactions. In essence, UTXOs define where each blockchain transaction starts and finishes.
What Does the UTXO Value Distribution Monitor Show?
The colored bars represent daily changes in the amount of BTC held in different UTXO value bands:
- Red Bars: Changes in UTXOs holding more than 10,000 BTC.
- Violet Bars: Changes in UTXOs holding between 1,000 and 10,000 BTC.
What Does This Indicator Tell Us?
The UTXO Value Distribution Monitor helps us understand the behavior of BTC holders, from small investors to large whales (very large holders). Here’s what it can tell us:
Accumulation and Distribution:
Positive changes mean more BTC remains in that value band. For example, if the red bars (10,000+ BTC) are positive, large holders accumulate more BTC.
Negative changes indicate that BTC moves out of that value band. So, if the blue bars (1,000 – 10,000 BTC) are negative, mid-range holders sell their BTC.
Market Sentiment:
If large holders (10,000+ BTC) accumulate, it suggests they have long-term confidence in Bitcoin’s value.
If mid-range holders (1,000 – 10,000 BTC) are selling, they might be taking profits or reallocating their assets.
Market Dynamics:
The interaction between different value bands can indicate broader market trends. For example, if we see 1,000 – 10,000 BTC holders selling and 10,000+ BTC holders buying, it suggests that the market’s big players are confident in Bitcoin’s future at current prices, even if smaller players are less certain.
Read more: Bitcoin (BTC) Price Prediction 2024/2025/2030
In summary, Bitcoin’s price stability within the $67,000 to $68,000 range, coupled with declining volatility, suggests a maturing market. The drop in the activity rate and the rise in the vaulting rate indicate a shift towards long-term holding, reflecting increased confidence among major holders.
The UTXO Value Distribution Monitor further supports this, showing large holders accumulating BTC while mid-range holders selling. These trends point to a market where big players are optimistic about Bitcoin’s future, reinforcing its potential as a long-term investment.
The post Bitcoin (BTC) Stability and Long-Term Holding: Market Dynamics Analysis appeared first on BeInCrypto.