Ethereum Price Dips May Offer Buying Opportunity — Bulls Eye Reentry
Ethereum price extended its increase above the $2,720 zone. ETH is now correcting gains and might revisit the $2,500 support zone.
- Ethereum started a fresh increase and cleared the $2,720 resistance.
- The price is trading above $2,520 and the 100-hourly Simple Moving Average.
- There is a short-term declining channel or a possible bullish flag forming with resistance at $2,630 on the hourly chart of ETH/USD (data feed via Kraken).
- The pair could find bids near $2,500 and start a fresh increase in the near term.
Ethereum Price Dips Again
Ethereum price remained supported and started a fresh increase above $2,620, beating Bitcoin. ETH gained pace for a move above the $2,650 resistance zone.
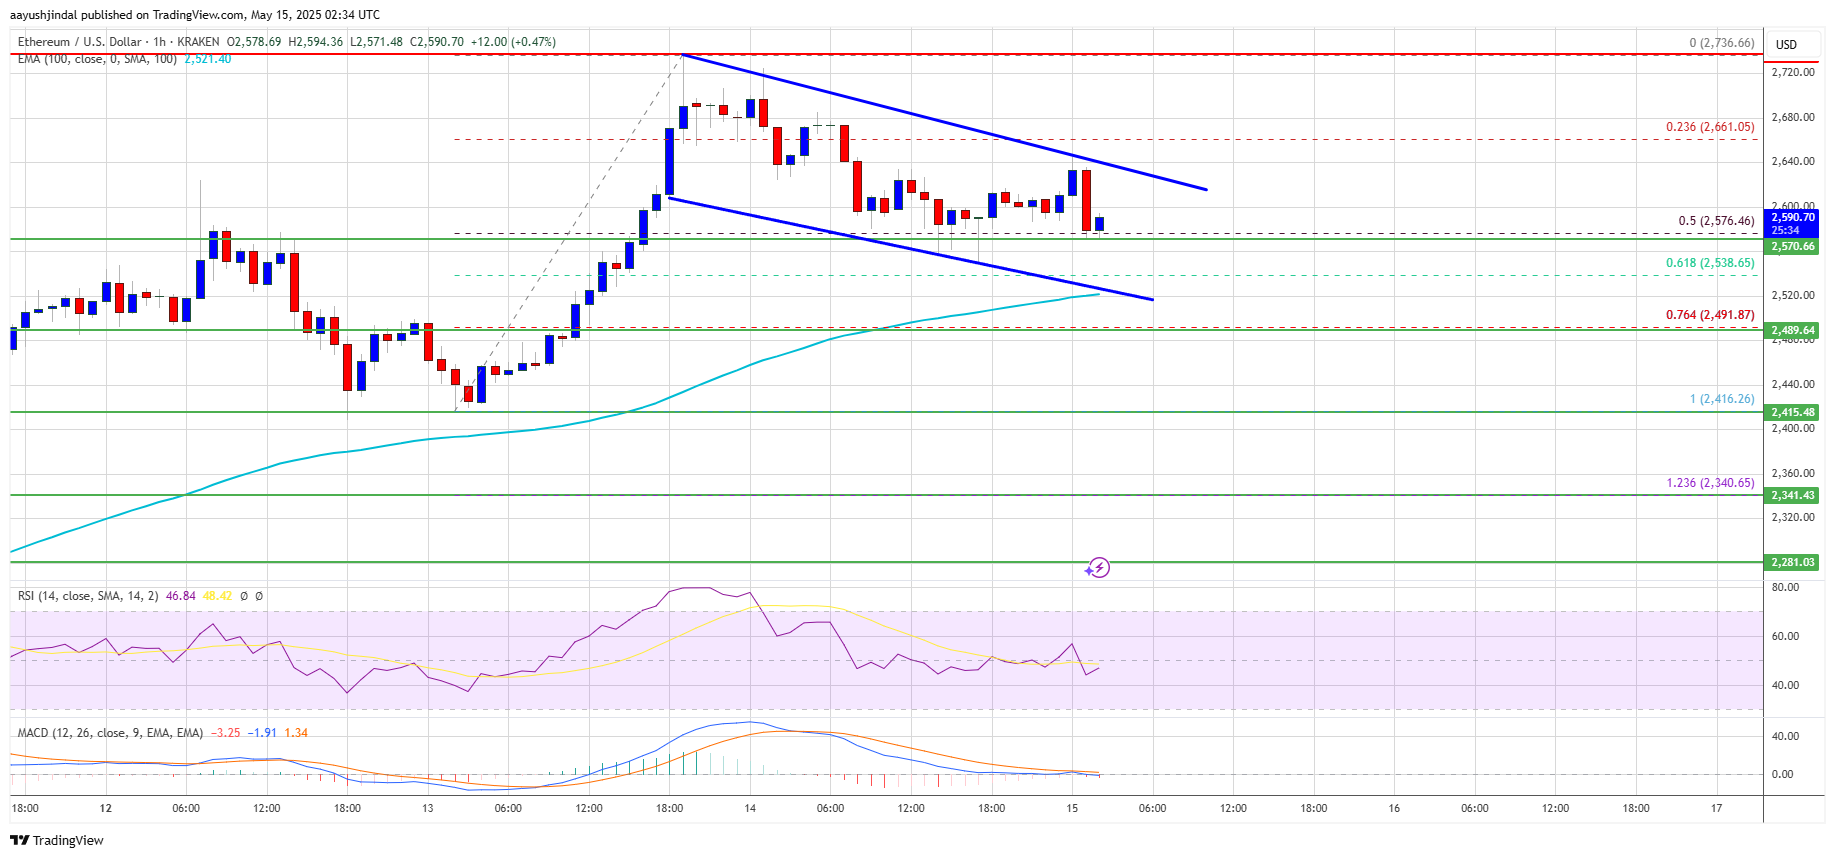
The bulls were able to push the price above the $2,700 resistance zone. A high was formed at $2,736 and the price is now correcting gains. The price dipped below $2,650 and even spiked below the 50% Fib retracement level of the upward move from the $2,415 swing low to the $2,736 high.
However, the bulls are still active above $2,550. Ethereum price is now trading above $2,550 and the 100-hourly Simple Moving Average. On the upside, the price seems to be facing hurdles near the $2,620 level. There is also a short-term declining channel or a possible bullish flag forming with resistance at $2,630 on the hourly chart of ETH/USD.
The next key resistance is near the $2,680 level. The first major resistance is near the $2,720 level. A clear move above the $2,720 resistance might send the price toward the $2,820 resistance. An upside break above the $2,820 resistance might call for more gains in the coming sessions. In the stated case, Ether could rise toward the $2,880 resistance zone or even $2,950 in the near term.
More Losses In ETH?
If Ethereum fails to clear the $2,630 resistance, it could start a fresh downside correction. Initial support on the downside is near the $2,575 level. The first major support sits near the $2,500 zone or the 76.4% Fib retracement level of the upward move from the $2,415 swing low to the $2,736 high.
A clear move below the $2,500 support might push the price toward the $2,420 support. Any more losses might send the price toward the $2,350 support level in the near term. The next key support sits at $2,320.
Technical Indicators
Hourly MACD – The MACD for ETH/USD is losing momentum in the bullish zone.
Hourly RSI – The RSI for ETH/USD is now below the 50 zone.
Major Support Level – $2,575
Major Resistance Level – $2,680