Will Bitcoin (BTC) Crash Again? Key Data Predicts What’s Next
The post Will Bitcoin (BTC) Crash Again? Key Data Predicts What’s Next appeared first on Coinpedia Fintech News
Bitcoin (BTC), the world’s largest cryptocurrency by market cap appears bearish and may experience a notable price decline in the coming hours or days. On October 18, 2024, BTC hinted at a potential price correction as it formed a bearish candlestick pattern at a strong resistance level.
Bitcoin (BTC) Technical Analysis and Upcoming Levels
According to expert technical analysis, BTC is currently facing strong resistance at the upper boundary of a descending channel pattern. Since March 2024, BTC has reached this level more than six times, experiencing notable selling pressure and a price decline of over 20% each time.
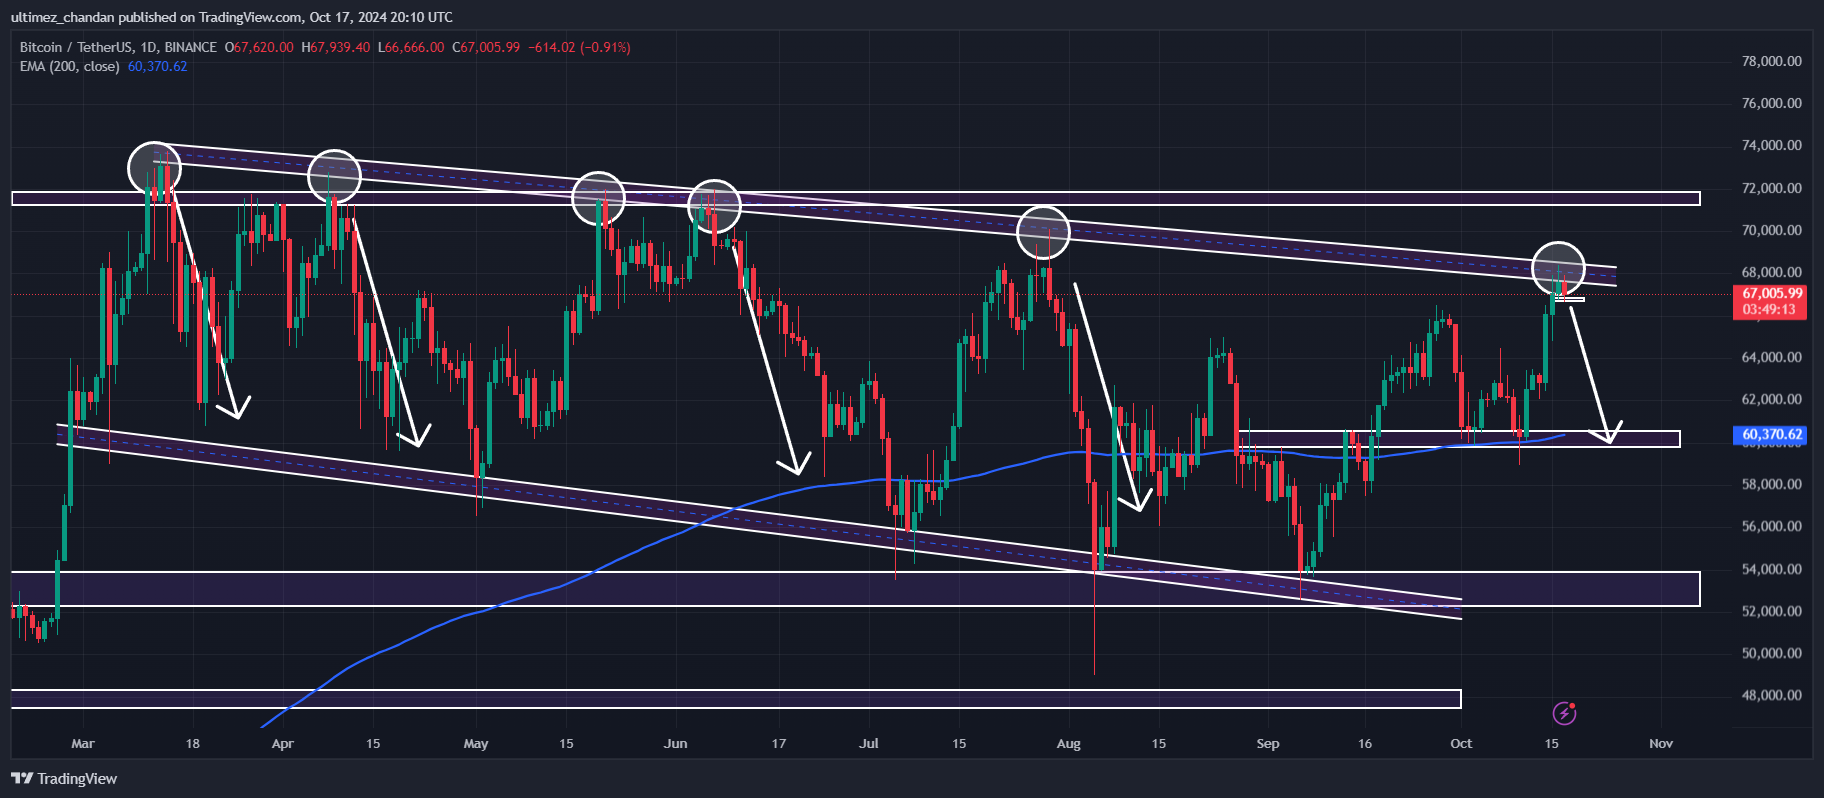
However, the formation of a bearish engulfing candlestick pattern on the daily time frame suggests a similar price decline in the coming days
Besides this bearish outlook on the daily time frame, a closer look at the BTC chart on the four-hour timeframe shows that the world’s largest cryptocurrency is currently finding support at the $66,700 level. Additionally, BTC has been consolidating between $66,700 and $68,000 over the past two trading days.
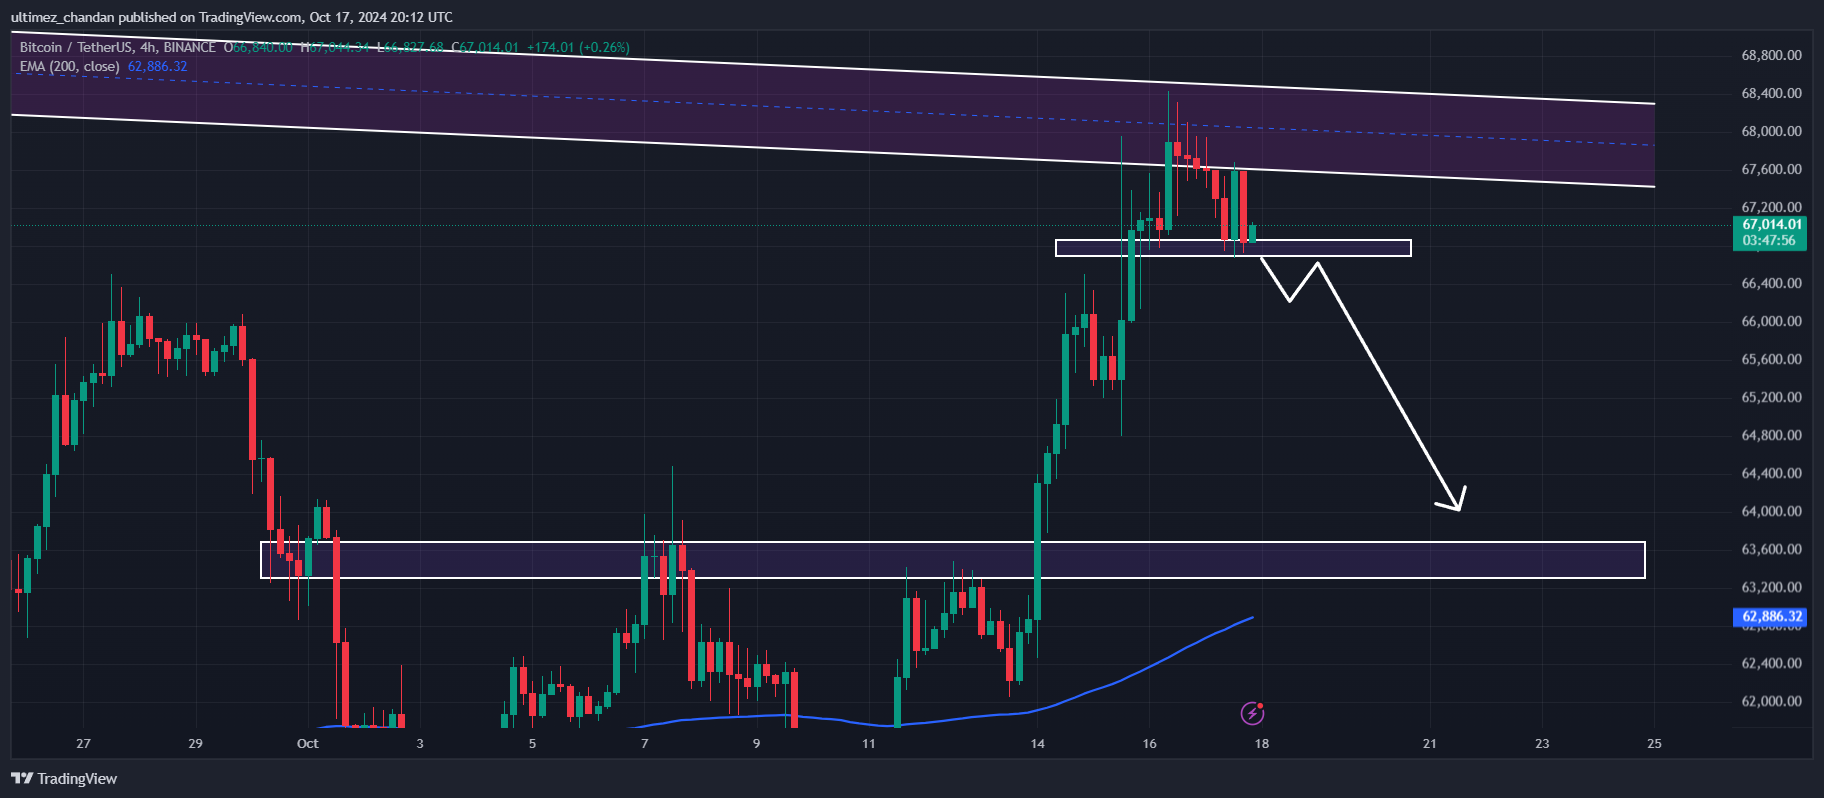
Based on the recent price momentum, if BTC breaks the lower boundary of the consolidation zone and closes a daily candle below the $66,500 level, there is a strong possibility that the asset could decline by over 6% to reach the $62,500 level.
Bearish Sentiment Confirmed by On-Chain Metrics
BTC’s negative outlook is further supported by on-chain metrics. According to the on-chain analytics firm Coinglass, BTC’s Long/Short ratio currently stands at 0.968, indicating bearish sentiment among traders. Additionally, its future open interest has dropped by 3.43% over the last 24 hours and 1.85% over the past 24 hours.
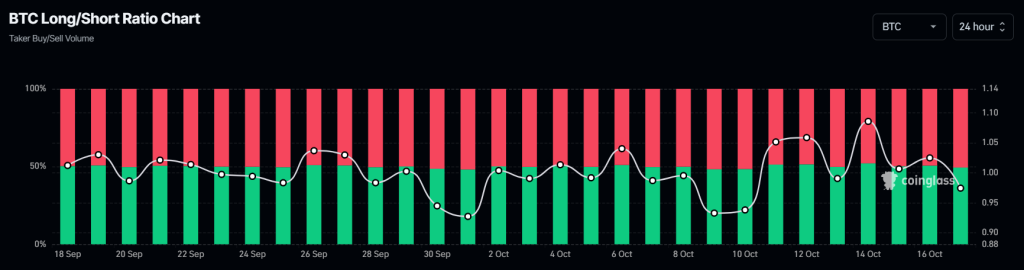
This decline in open interest suggests either the liquidation of traders’ long positions or traders exiting their positions, likely due to fear of a price crash.
Combining these on-chain metrics with the technical analysis, it appears that bears are currently dominating the asset and have the potential to trigger a massive price decline.
Current Price Momentum
At press time, BTC is trading near $66,920 and has experienced a price decline of over 1.8% in the past 24 hours. During the same period, its trading volume dropped by 21%, indicating lower participation from traders due to the current market sentiment.
